
Join Dataflo @ SaaS Insider's India 2022 on May 26 - 27
Register Now


Running Ads online can be tricky if you don’t track all the metrics. After all, how will you measure your success if you don’t track all the key metrics?
You will need a tool that can help you track everything and then turn those insights into a presentable report.
There helps Google Data Studio, also known as Looker Studio.
Google data studio or Looker Studio is a tool that allows you to create dashboards using various sources of data from Google Analytics, Adwords, etc. In this article, I'll show you how to build an ads campaign dashboard using Looker studio.

Paid campaigns are a type of advertising that allows businesses to target specific audiences based on demographics, interests, behaviors, and location. They also allow advertisers to track performance metrics like clicks, impressions, conversions, and cost per click.
In order to run successful paid campaigns, marketers must first set up a dashboard. A dashboard that reflects every key metric and helps the marketer track the performance of the ads on various platforms.
Here’s a quick overview of what a paid campaign dashboard does and how it differs from a regular ad management platform.
Most paid campaign dashboards provide analytics tools that let you monitor key performance indicators, including clicks, impressions, conversion rates, and cost per click (CPC). These numbers give you insight into how well your ads perform.
Once you’ve identified your audience, you can refine your targeting criteria so that only relevant users receive your message. For example, you may choose to display ads to users who have visited certain websites within the last week. Or you may decide to reach out to users who have recently searched for keywords related to your product or service.
You can also segment your audience based on demographic information, such as gender, age, income level, and geographic region. Once you’ve created custom segments, you can select them when creating your targeted audience.
Advertisers can place ads across multiple platforms, including social media sites, search engines, mobile apps, and email newsletters. Paid campaign dashboards make it easier to manage all these placements simultaneously.
After you launch your campaign, you can view detailed reports that break down performance metrics by day, hour, and minute. You can also access daily, weekly, monthly, and yearly summaries of your results.
Looker Studio is an important tool for marketers who are looking for an automated monthly PPC reporting solution. The reports generated by this tool provide data that can be used to analyze the performance of marketing activities.
Marketers can access data from multiple sources and generate a range of reports using it. They can also create dashboards that display their data in a way that is customized to their requirements. This helps to make the information easier to digest and provides scope for deeper analysis.
However, Looker Studio comes with its own set of drawbacks and limited features. We’ll discuss the challenges with Looker Studio in detail later in this article.
After the advertising is set up, the most important thing is to keep track of its performance. You can choose some metrics to measure your campaign and identify which one works best for your campaign.

Data Studio is a free tool from Google that allows you to integrate data from different sources, then create and share reports and dashboards. It also has a drag-and-drop interface, which makes it easy for non-technical users to create their own reports.
As aforementioned, there are also some challenges in building a paid ads dashboard using Looker Studio-
Real-time updates are crucial for most businesses that need a tool that can help them make quick decisions.
The first issue here arises with Data Studio when a user tries to change the data source structure. In this situation, the user will need to reconnect the source manually to get the changes in the dashboard.
The second issue comes when new data is being introduced to the data source. In this case, you’ll need to refresh the dashboard manually on the browser to make the change. Although, you can add a third-party browser extension for scheduling automatic refreshing.

While live connection data sources is an amazing feature of Data Studio, it also comes with a slow refresh rate. This slow speed is directly proportional to the complexity of functions implemented in the dashboard.
Another significant drawback of Looker Studio is the number of charts per report page allowed. The tool only allows up to 50 components per page. The drawback goes even further by limiting the number of specific types of charts per page. For example, you can’t add more than three pivot tables per page.
Just like any other sibling tools like Google Analytics and Google Search Console, there’s no option to connect with customer support. There are limited help documents available from Google’s side.

In this step-by-step guide, we’ll be setting up a PPC dashboard using Looker Studio.
Go to Looker Studio and start with a “Blank Report.”

Once you get to the black report page, you’ll be asked to connect to a data source. Looker Studio will use that data source to pull out all the crucial data and turn them into a visual report. Here we are connecting it to Google Adwords to pull out all the Google Ads-related data. You can use other platforms like Facebook, LinkedIn, etc., to create a report.

After you click on Adwords, Looker Studio will ask you to authorize Adwords. Once you authorize it, it will show you all the accounts that are available in Adwords. From the list, you need to choose the account you want to pull the data from and create a report.

Once you’re completely in, you can choose some scorecards that you want to use for showing the key metrics. To add scorecards, go to “Insert” and choose the scorecards you want to display from the drop-down menu.

Now that you’re done choosing a scorecard, you can add multiple metrics from the right panel. Click on “Metric” from the right panel, and you’ll see several metrics available. You can choose the ones that you need in your report from the list.
Once you’ve added the right metrics, it’s time for you to use charts to present your data. There are several charts to choose from, like Pie Charts, Bar Charts, etc.
To add a chart, select “Add a Chart.” Here we are adding a Bar Chart.

Once again, go to the right panel, and modify the dimensions and metrics to the required ones.
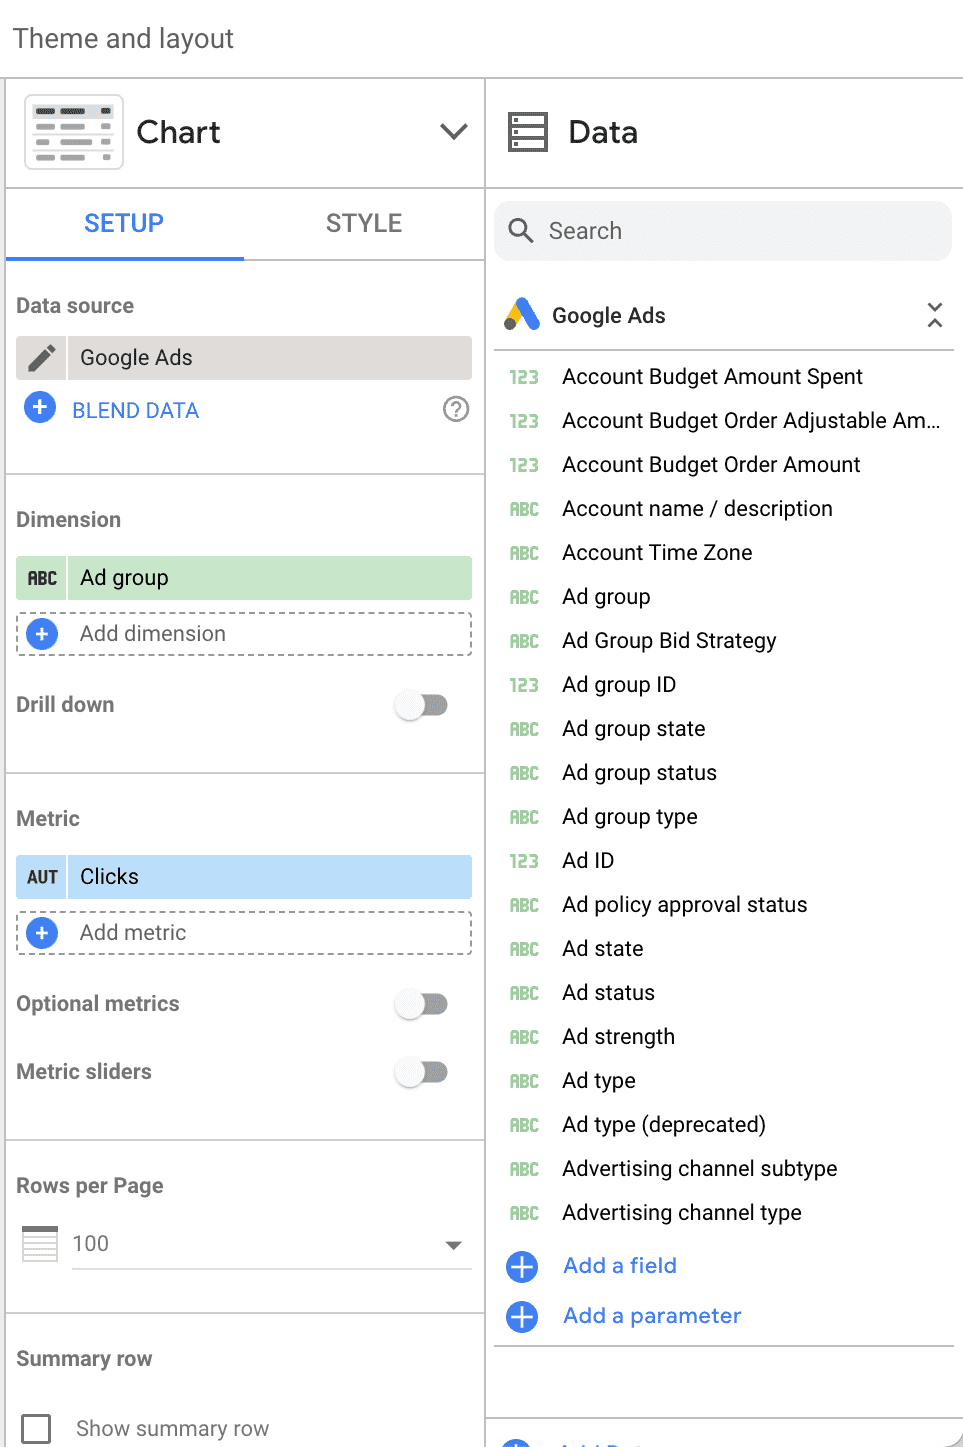
If you don’t like the current design of the report, you can head on to “Themes and Layouts” to style the dashboard. It will provide you with a list of available layout options to customize the dashboard.

Now that everything is set in your dashboard, you can “View” your dashboard to check the final version. Here you can check if everything is fine or if there’s a need for modification.
No one likes an “Untitled Report,” so add a name to help you and others identify the report.

Everything is set, and now you can share your report with anyone who needs it. You can also ask other stakeholders if they need to modify anything. The best part is you can provide them with editing access, and they can make any necessary changes by themselves.
Once done, you can share the report with the client.
If your company is advertising on multiple platforms such as Google Ads, LinkedIn Ads, and Facebook Ads, it can be challenging to track the overall performance of the ad spend across all of these platforms.
Looker Studio can help by allowing you to connect multiple data sources and view all of their data in one place, making it easier to see metrics like total ad spend, total leads received, and total clicks or CTR.
However, Looker Studio does not provide attribution, which helps in tracking the performance of each marketing channel and also you can determine which channels are delivering a good ROI and which may not be as effective.
By using tools like Dataflo, marketers can visualize the breakdown of channel, source, and campaign levels which helps to better understand the performance of the marketing and make informed decisions about how to allocate your budget and prioritize the efforts.
This can help to maximize return on investment and ensure that marketing campaigns are as effective as possible.


As a rising leader, Anand is dedicated to helping his team succeed by inculcating a great culture of collaboration. His passion for technology that knows no bounds has helped elevate the company to new heights. He loves photography, listening to music, and watching thriller movies. He’s also into fitness—it keeps him feeling good and healthy!


