Join Dataflo @ SaaS Insider's India 2022 on May 26 - 27
Register Now


As a key stakeholder in a SaaS business, you know that driving growth requires a combination of strategy, hard work, and continuous improvement.
But how do you track your progress and ensure you're on the right track?
One important metric that provides valuable insight into the health and success of your business is its growth rate.
In this article, we will explore the formula for calculating a SaaS business's growth rate as well as other important metrics to consider when evaluating your company's growth.
Tracking your business' growth rate will enable you to make more-informed decisions about what steps are likely to lead towards long-term success.
.png)
The growth rate measures how quickly a quantity increases or decreases over a specific period. It is commonly used in various fields, including population, personal finance, business, and SaaS (Software as a Service).
Growth rates are often expressed as a percentage or a decimal, and it is calculated by comparing the current value of a quantity to its value in a previous period.
A population’s growth rate is defined as a measure of how fast a population is growing or shrinking over a specific period. This can be calculated by dividing the change in population by the starting population.
For instance, if a population had 1,000 people in January and grew to 1,100 people in February (an increase of 100), then the population growth rate would have grown by 10%.
Positive population growth indicates expansion, while negative population growth reveals a shrinking population.
In personal finance, the growth rate is a measure of the increase or decrease in the value of an investment over time.
For example, if you invested $1,000 in a stock and it increased in value to $1,500 over a year, the growth rate would be 50%. This indicates that the value of the investment increased by 50% for that year.
Analyzing growth rates can be valuable in personal finance, as it can help you to compare the performance of different investments and make better decisions about where to invest your funds.
In business, the growth rate is the rate at which a company's revenue, profits, or other essential metrics increase or decrease over time.
The growth rate is an essential metric for businesses to track, as it can provide insight into the health and success of the company.
A company that has a high growth rate may be expanding rapidly and experiencing strong demand for its products or services—whereas one with low or negative growth is likely having trouble attracting new customers.
The growth rate in SaaS (Software as a Service) refers to the rate at which a SaaS company's revenue or user base grows over time.
In SaaS, the growth rate can be calculated for any metric: number of customers, average revenue per customer or total revenue. These metrics help us understand how well a business is running and can provide valuable insights into the health and potential of the business.
The formula for calculating growth rate is a simple and widely-used method for tracking the increase or decrease of a quantity over time.
It is expressed as a percentage or decimal and can be used to compare the growth of different metrics, such as revenue, profits, and customer base.
Growth Rate is calculated by subtracting the prior period value from the current period value divided by the prior period value.

For instance, if a SaaS company had $10,000 in MRR in January and $11,000 in MRR in February, the month-over-month growth rate for MRR would be:
Growth Rate = ($11,000 - $10,000) / $10,000 = 0.10, or 10%
This shows that the company experienced a 10% increase in MRR from January to February.
It's important to note that MRR is just one of many metrics that SaaS companies should be tracking. Other important metrics include customer acquisition cost (CAC), lifetime value (LTV), and churn rate.
Related: If you're looking for a more detailed explanation of calculating the finance metrics, be sure to check out this blog post on 8 Key Business Metrics to track in a Subscription Dashboard.
As a B2B SaaS company, it's essential to track key metrics to understand the health and growth of your business.
In this section, we'll delve into eight key growth metrics that can help you experiment with different tactics and identify the most effective strategies for driving growth.
MRR measures the total revenue that a SaaS business generates monthly from recurring sources, such as subscription fees and recurring contracts.
The MRR formula can be calculated by multiplying the number of paying customers by average revenue per customer per month.
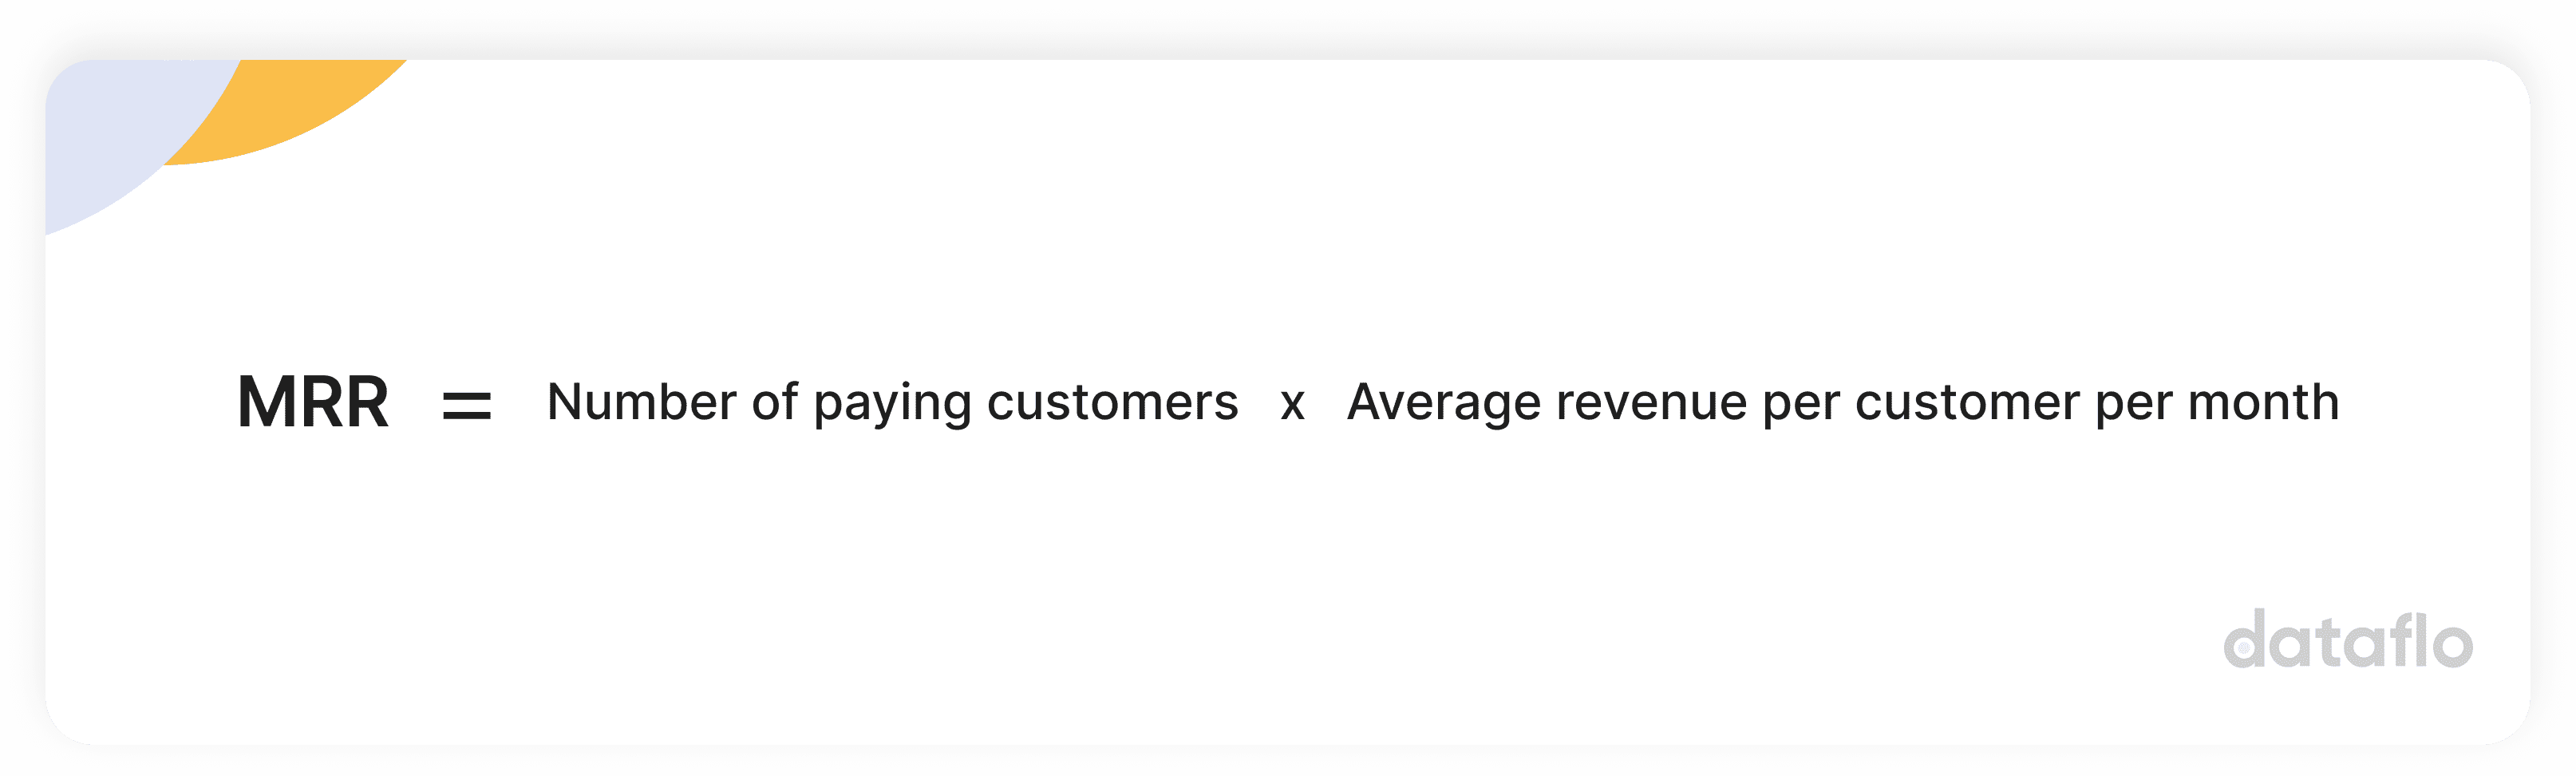
For example, if a company has 100 customers paying $50 per month for a subscription, their MRR would be $5,000.
Keeping an eye on MRR can help you identify revenue growth trends and provide insight into the effectiveness of pricing and pricing strategies.
For more information on how to calculate MRR, check out our detailed guide here.
This metric is similar to MRR; however, the revenue that a SaaS company generates on an annual basis from recurring subscriptions.
.png)
For example, if a company has an MRR of $5,000 per month, its ARR would be $60,000 per year (assuming no change in MRR for a year).
Tracking ARR over time can provide a longer-term view of your company's revenue growth and help you identify trends.
Cost of Customer Acquisition (CAC) is a metric that measures the cost of acquiring a new customer for a business.
This cost includes all marketing and sales expenses incurred to convert a potential customer into a paying customer.
The formula for calculating Cost of Customer Acquisition is dividing the total marketing and sales expenses by the number of new customers acquired.

For example, if a SaaS company spends $10,000 on marketing and sales expenses in a given month and acquires 100 new customers, the CAC would be calculated as follows:
CAC = $10,000 / 100 customers = $100 per customer
Determining the cost of acquiring new customers (CAC) can assist businesses in identifying the most effective methods for reaching out customers and ensure that the cost of acquiring new customers is in line with the lifetime value of those customers.
Customer Lifetime Value refers to the total revenue a business expects to generate from a single customer over their relationship with the company. Customer Lifetime Value (CLV) can be calculated by multiplying the average purchase value with the purchase frequency and the average customer lifespan.

For example:
If a company has an average purchase value of $50, a purchase frequency of twice per year, and an average customer lifespan of 5 years, the CLV would be calculated as follows:
CLV = $50 x 2 purchases/ year x 5 years = $500
Customer lifetime value (CLV) is a vital metric for businesses because it helps them understand the value of their customer relationships over time.
By measuring CLV, businesses can allocate their resources more effectively and prioritize their efforts to target their most valuable customer segments.
The signup rate is the percentage of visitors to a website who sign up for a trial or subscription.
It's a valuable indicator of the effectiveness of a company's marketing efforts and can help identify areas for improvement.
Signup rate can be calculated by dividing the number of signups by the number of visitors and multiplying it by 100

For example, if a SaaS company has 100,000 visitors to its website in a given month and 1,000 of them complete the signup process, the signup rate would be:
Signup rate = (1,000 signups / 100,000 visitors) * 100 = 1%
Analyzing the signup rate can help a SaaS business gain insight into customer behavior and identify opportunities to improve its marketing and sales efforts.
Expansion revenue is a company's additional revenue from its existing customers, such as through upsells or cross-sells. It's a way for a company to grow its revenue without acquiring new customers.
For example, let's say you have a SaaS company that offers a project management tool. A customer signs up for your basic plan, which includes task tracking and team communication features.
After using the tool for a few months, the customer realizes they could benefit from additional features such as invoicing and time tracking.
They decide to upgrade to a premium plan that includes these features, which generates additional revenue for your company. This additional revenue is considered expansion revenue.
In this example, the customer was already using your company's product, but adding additional features generates more revenue for your company.
This is a common way for SaaS companies to generate expansion revenue by offering value-added products or services to existing customers and encouraging them to increase their usage.
The churn rate metric reflects the percentage of customers who stop using a product or service or cancel their subscriptions.
You can calculate the churn rate by simply dividing the customer churned over a period of time divided by the customer at the start of that time period and multiplying by 100.

For example, if a company has 1,000 customers and 100 of them cancel their subscriptions in a given month, the churn rate would be 10%. It's an indicator of customer satisfaction and can help a company identify issues causing customers to leave.
Churn Rate = (100 / 1000) * 100 = 10%
It's important to note that the churn rate can be positive or negative. If your company gains more customers than it loses over a given period, the churn rate will be negative.
Why is the churn rate significant? A high churn rate (above 5% or so) could indicate that your company is having trouble retaining customers and may be at risk of losing revenue.
This could signify that your product or service needs to meet customer needs or that you're losing customers to competitors.
On the other side, a low churn rate (below 2% or so) suggests that your customers are happy and sticking around, which can be a positive sign for the health and growth of your company.
Net Promoter Score (NPS) reflects customer satisfaction which assesses the likelihood of a customer recommending a company's products or services to others.
It's typically calculated by asking customers to rate their likelihood of recommendation on a scale of 0 to 10, with higher scores indicating a higher chance of recommendation.
To calculate NPS, companies typically survey a sample of their customers and ask them the following question:
"On a scale of 0 to 10, how likely are you to recommend our company to a friend or colleague?"
Customers who respond with a 9 or 10 are considered "promoters," while those who respond with a 0 to 6 are considered "detractors." Customers who respond with a 7 or 8 are considered "passives."
This means that to calculate the NPS, you need to take the percentage of customers who are "promoters" of your product or service and subtract the percentage of customers who are "detractors".

NPS is calculated by the difference in the percentage of detractors from the percentage of promoters. So, for example, if a company surveys 100 customers and finds that 50% are promoters, 40% are passives, and 10% are detractors, their NPS would be calculated as follows:
NPS = (50% - 10%) = 40%
A high NPS is generally considered a good sign, as it indicates that a company has high customer satisfaction and loyalty. NPS is often used as a key performance indicator (KPI) for companies to track over time and compare to industry benchmarks.
Dataflo is a cloud-based GTM operating system and analytics platform that helps companies track and visualize key performance indicators (KPIs) and other business data.
It allows businesses to connect to various data sources, such as CRM systems, financial software, and marketing tools, and combine that data in a single platform.
Dataflo gives you a quick and easy way to calculate your growth rate so that you can track it over time and understand how your business is performing.
The platform also offers a wide range of visualization and reporting features to help you analyze your growth rate and optimize your company's performance.
Stripe is a payment processing platform that facilitates businesses to accept and manage online payments.
It provides various tools for managing transactions, subscriptions, invoicing, and reconciliation, as well as detailed analytics and reports on payment activity.
In addition to its payment processing capabilities, Stripe also offers a range of analytics tools that can help you calculate and analyze your growth rate.
Stripe can calculate and analyze a business's growth rate by tracking metrics such as payment volume, conversion rate, and average transaction value.
Chargebee is a platform that enables businesses to automate billing processes and optimize recurring payments.
It also offers various tools for managing subscriptions, invoicing, payments, and customer data, as well as detailed analytics and reports on billing and revenue trends.
Chargebee can be used to calculate and analyze the growth rate of a business by tracking essential metrics, such as monthly recurring revenue, churn rate, and lifetime value.
Paddle is a software monetization and analytics platform that helps businesses to sell, manage and grow their software products.
It provides various tools for managing licensing, activation, billing, customer data, detailed analytics, product performance, and user behavior reports.
Paddle can calculate and analyze a business's growth rate by tracking essential metrics, such as product adoption, usage, and retention.
It includes analytics and reporting features that allow companies to track the growth of their software sales and understand the factors contributing to that growth.
QuickBooks is a financial software that helps small and medium-sized businesses manage their accounting and financial operations.
It provides various accounting, budgeting, invoicing, and reporting tools and integration with other business systems and applications.
QuickBooks can calculate and analyze a business's growth rate by tracking key metrics, such as revenue, profit, and cash flow.
Xero is another accounting software that helps businesses manage their finances, including tracking revenue and expenses.
It provides a range of features, including invoicing, expense tracking, bank reconciliation, and inventory management, as well as integrations with other business tools, such as payment processors and point-of-sale systems.
It also includes analytics and reporting features that allow companies to track their financial performance over time and identify trends and patterns that may be contributing to their growth.
Tracking and analyzing growth rates is essential to managing and optimizing a B2B SaaS company's performance.
While a range of tools available can help companies track and understand their growth rate over time, Dataflo stands out as a powerful and customizable option in the market.
One of the key features of Dataflo is its ability to track and visualize KPIs and metrics in one single dashboard. With its cloud-based data analytics and visualization platform, Dataflo’s Subscription Dashboard enables businesses to easily view how their revenue and customer base are growing and identify trends and areas for improvement.
Additionally, Dataflo offers a range of customization options, so companies can tailor their growth rate tracking to fit their specific needs.
These features make Dataflo an excellent all-in-one tool for understanding and optimizing a B2B SaaS company's performance.
On the whole, if you are looking for a powerful and customizable tool to help you track and optimize your growth rate, we recommend giving Dataflo a try.
Book a demo today and start tracking your growth rate to optimize your SaaS company's performance.


Ira is a writer and blogs about her love of words. She has been responsible for creating powerful and effective content that attracts and retains customers. A blend of her humble writing experience and an endeavour to inspire people with her words is on her table now. She is an avid reader and a music lover too. She loves to devote time each day to yoga and meditation in addition to going for walks.